In 2009 Shri Kulkarni gave a very thought-provoking presentation at the Pasadena postdoc retreat in Lake Arrowhead California. He suggested that one of the biggest problems facing astronomical transient surveys is a profound lack of efficient spectrographs on telescopes. I discovered that a highly efficient spectrograph on a 1.5-m telescope would accommodate a large amount of the spectroscopic need of astronomers. Coming from the land of the 10- and 30-meter telescopes; this idea seemed almost sacrilegious. It turns out, that asteroid taxonomists, supernova classifiers, and weirdo-star hunters actual do need this sort of spectroscopic capability, and it is not well serviced by observatories today. Thus, Shri’s presentation led me (with the help of Robert Quimby and Shri) to invent the SED Machine!
What is the SED Machine?
The SED Machine is a spectrograph and imager for efficient and rapid classification. It is efficient by design and it is designed for rapid followup as a permanent fixture on robotic 1- to 2-meter class telescopes. Send coordinates and you’ll have a spectrum in half an hour. We designed the SED Machine to be ideal for classifying supernovae, but we hope it will play a big role in taxonomical studies of asteroids and variable stars. The first implementation of SED Machine sits at the Palomar 60-inch telescope; we do hope to create copies. The SED Machine was led by two Caltech postdocs: Principle Investigator Nick Konidaris and project scientist Robert Quimby. Since the project started both now have permanent positions. Student Sagi Ben-Ami (then of Weizmann institute) played a crucial role in the design and development of the imager.
The SED Machine was funded via NSF 1106171 and from funding to first light took about 23 months.
In detail, the spectrograph operates at a classification resolution (
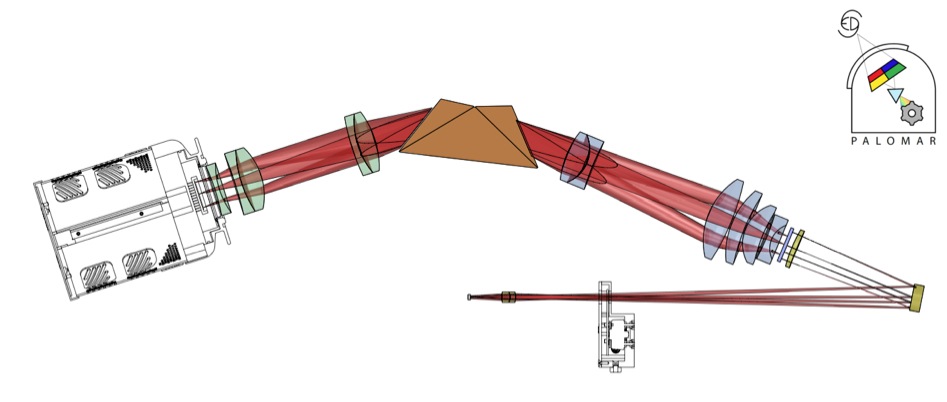
If you take the instrument covers off, and hide some of the supporting elements, you see something that looks like this:
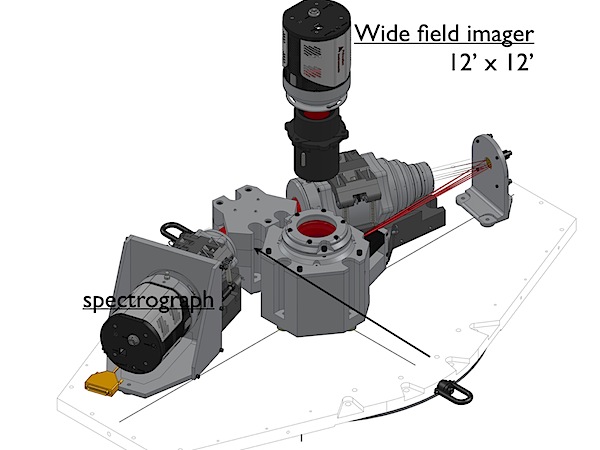
The Rainbow Camera
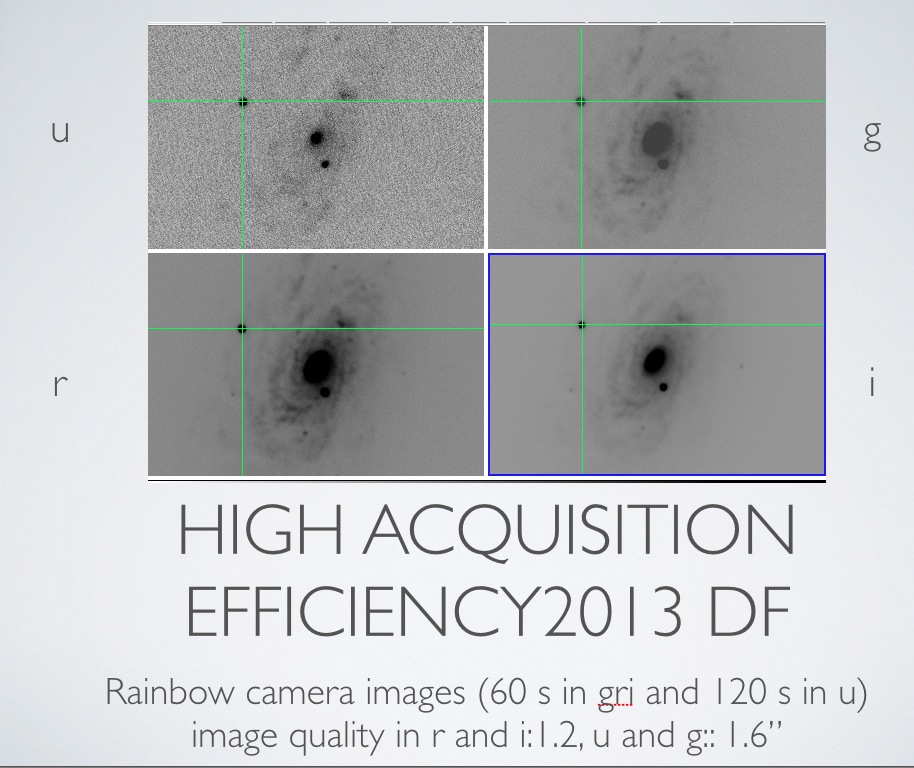
The rainbow camera is a four-channel imager that simultaneously images in u, g, r, and i. Raw frames look like this:
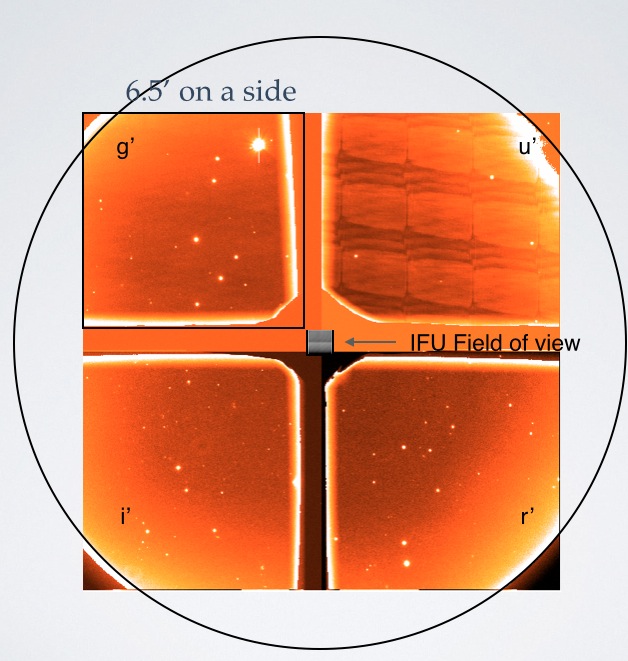
The four filters are held in place by a + shaped metal structure. Each filter covers about 6.5’ on a side. In the center of the + is the spectrograph field (
Detailed specifications:
- Filters are u’, g’, r’, and i’ from Astrodon. Representative filter curves are found at astrodon.com.
- Pixel scale is about 0.375” / pixel in all bands. Each pixel is 13.5 µm on a side.
- The imager channel focal ratio is about f/4.9.
- Image readout of a Princeton Pixis camera takes 5 seconds in 2 MHz mode and 40 seconds in 100 kHz mode.
- The 2 MHz mode has X e- of read noise, and a clear non-random signal.
- The 100 kHz mode has about 4 e- of read noise.
- Detector gain is about 2, but the precise value is in the FITS header under the keyword GAIN.
The Spectrograph
The R~100 spectrograph operates from 370 nm to 920 nm. Image slicing is performed with a hexagonal lenslet array where the pitch between each pixel is about 0.65″. The total field of view of the spectrograph is about 28″ x 28″.
A spectrum of Saturn taken with SED Machine may help you develop intuition about how the instrument works.

The images are then converted into data cubes. An example of a collapsed data cube for a point source is shown below.
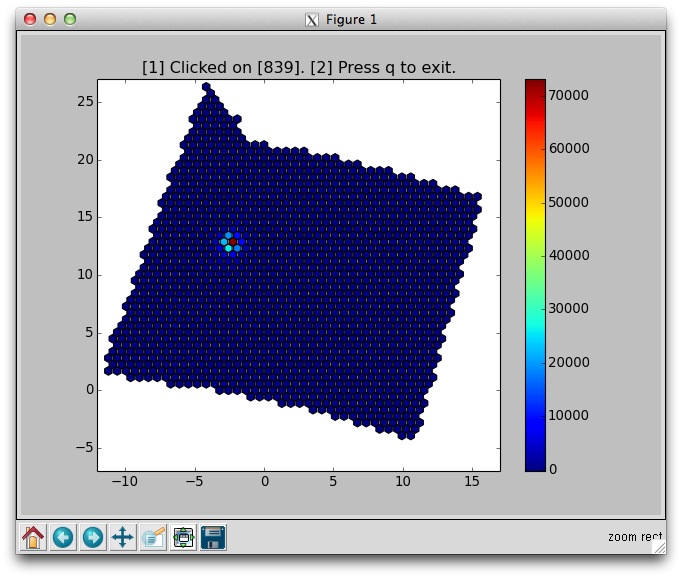
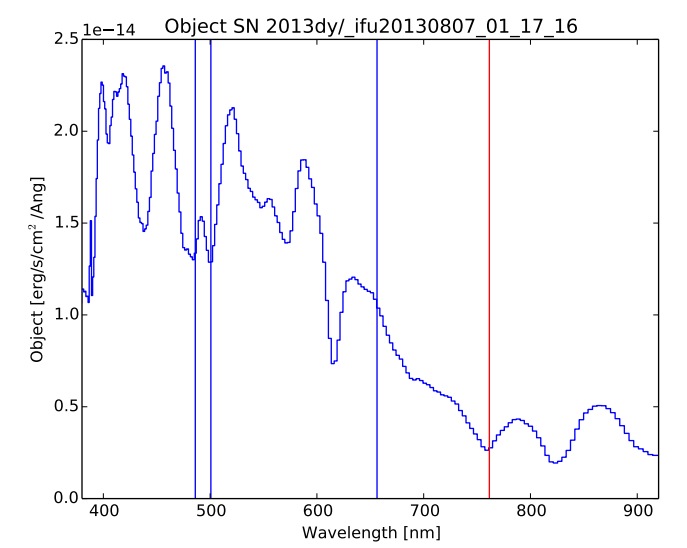
By clicking on the collapsed data cube, it is possible to extract a spectrum that looks like: